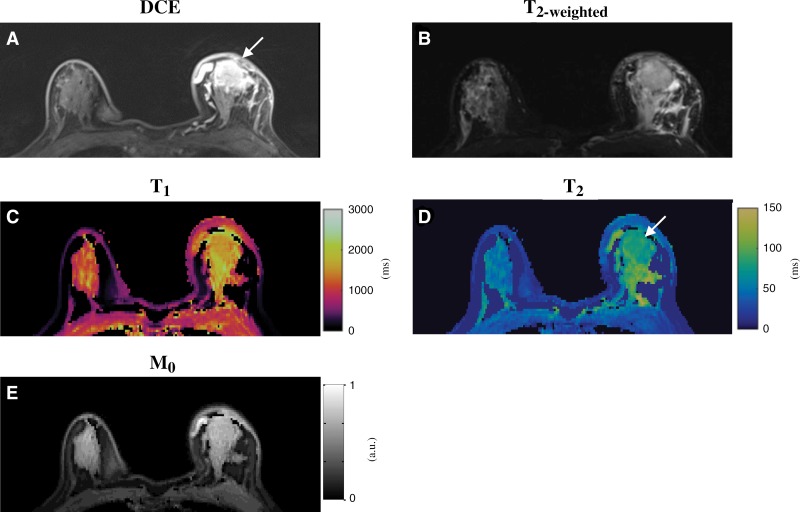
Figure 6:
Conventional and MR fingerprinting images in a 65-year-old female participant with invasive ductal carcinoma in left breast. A, Clinical postcontrast and, B, T2-weighted images. C–E, T1, T2, and proton density (M0) maps acquired from similar position as in A and B. Longer T1 and T2 relaxation times were observed for tumor (T1, 1473 msec ± 103; T2, 83 msec ± 5) compared with normal fibroglandular tissues in right breast (T1, 1198 msec ± 99; T2, 40 msec ± 5). Prolonged T1 and T2 relaxation times were also observed in surrounding fibroglandular parenchyma, which could be due to peritumoral tissue edema or postbiopsy changes. DCE = dynamic contrast material–enhanced.

