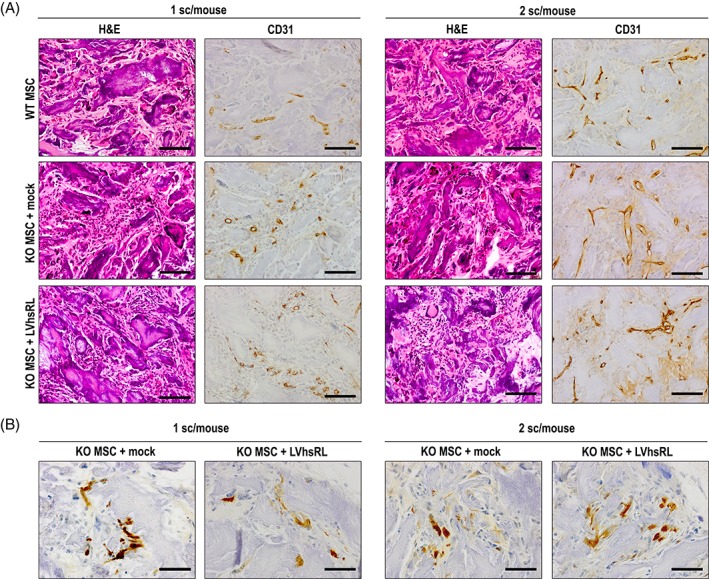
Figure 5.

Histological analysis of MSC‐seeded MgHA/Col scaffolds after 2 months implantation in Rankl −/− mice. (A) Hematoxylin–Eosin staining and CD31 immunostaining on serial sections of decalcified scaffolds from the different groups of treatment. Scale bar: 100 μm. (B) GFP immunostaining on sections of decalcified scaffolds from the different groups of treatment. Scale bar: 50 μm.
