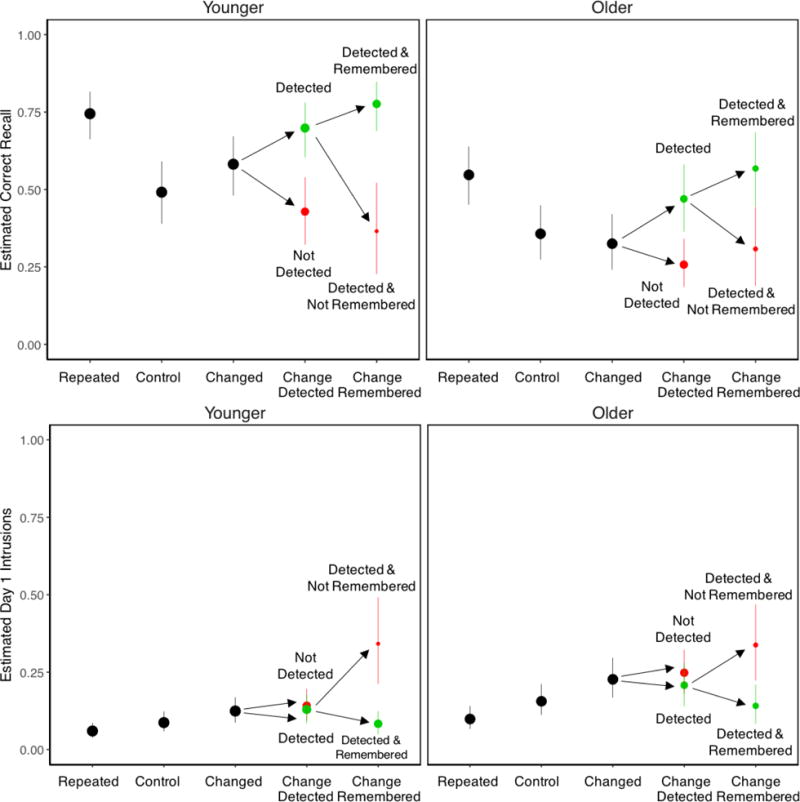
Figure 4.

Probabilities of Day 2 correct recall (top panels) and Day 1 intrusions (bottom panels). The areas of conditional points (in green and red) for changed activities refer to probabilities of change detection (correct classification of changed activities during Day 2 viewing) and remembering change (correct classification of changed activities during the cued recall test). Green points correspond to detected or remembered changes (correctly classified changed activities), whereas red points correspond to changes that were not detected or remembered (incorrectly classified changed activities). The heights of conditional points indicate probabilities of Day 2 recall and Day 1 intrusions. Error bars are bootstrap 95% confidence intervals.
