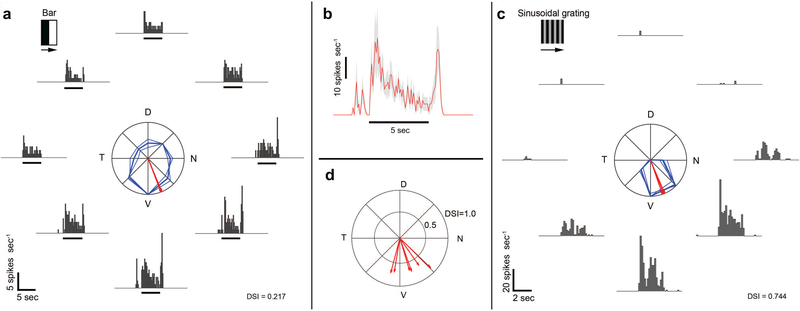
Figure 4: Pcdh9-Cre+ RGCs are ON-DS cells that prefer ventral motion.
(a) Directional tuning of Pcdh9-Cre+ RGCs, targeted based on their labeling after ocular injections of AAV2-FLEX-GFP. Firing rate of a representative RGC in response to bright bars drifting in eight directions at 45° intervals, shown as peristimulus time histograms (PSTHs). The black marker indicates the estimated time when the stimulus bar was within the cell’s receptive field. The polar plot shows response amplitude (normalized to maximum) for each direction (bold curves = mean of four trials; thin = single trial). Red vectors show preferred direction (bold, mean; thin, single trials; N, nasal; D, dorsal; T, temporal; V, ventral). The direction-selectivity index (DSI) is indicated on the bottom-right. (b) Average ± SEM firing rate in response to a bright bar drifting in the preferred direction (n = 6 cells). Pcdh9-Cre+ cells exhibit (1) a transient ON response preceding the entry of the bright bar into the cell’s receptive field, (2) a sustained ON response evoked by the bright bar, and (3) a transient OFF response evoked by the trailing edge of the bright bar. (c) Firing rate of a representative Pcdh9-Cre+ RGC in response to sinusoidal gratings drifting in eight directions at 45□ intervals. Conventions are similar to panel (a). (d) Preferred directions among cells examined (n = 6). Direction and length of vectors indicate the cell’s preferred direction and DSI, respectively. Preferred directions were determined from responses to drifting gratings.

