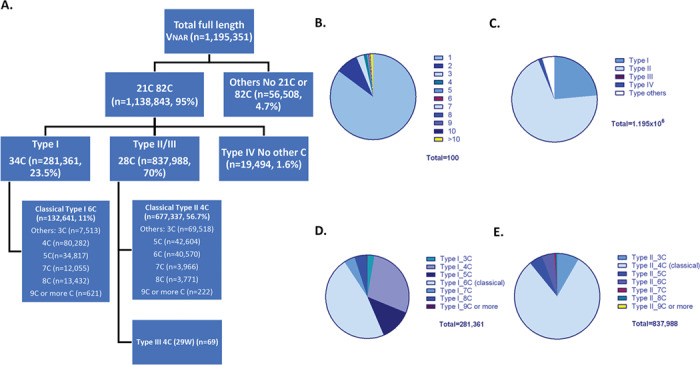
Figure 2.

NGS analysis of the shark VNAR library. (A) Flow chart of the criteria used to categorize the VNAR types for 1.2 million validated full-length shark VNAR sequences. (B) Pie chart of the percentage of repeated sequences. Numbers represent the times each unique sequences are repeated in NGS results. (C) Pie chart of the percentage of four types of VNARs and other type of VNARs. (D) Pie chart of the percentage of classical Type I VNARs with six cysteines and the other non-canonical Type I VNARs. (E) Pie chart of the percentage of classical Type II VNARs with four cysteines and the other non-canonical Type II VNARs.
