
Figure 5. Individual traces, and group onset threshold and thermosensitivity for FBF.
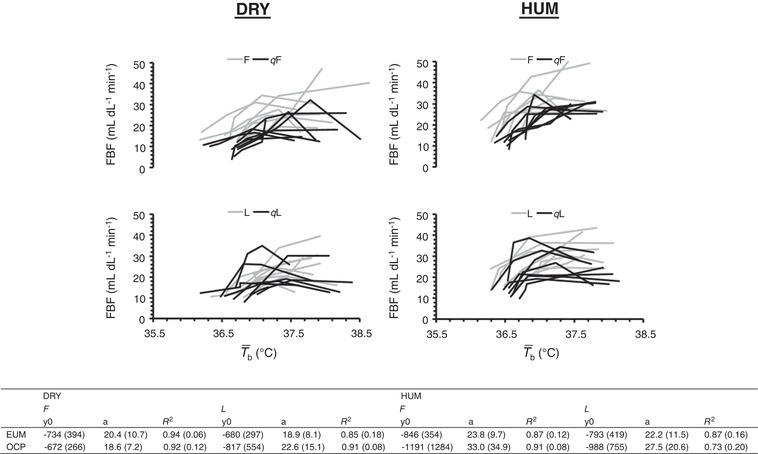
Upper: individual traces for FBF (n = 8) against mean body temperature ( b) during exercise in dry (DRY) and humid (HUM) heat during the qF and qL phase. Early follicular (EF) and mid‐luteal (ML) traces are provided for our previous eumenorrhoeic cohort (Lei et al. 2017). Lower: mean ± SD values for onset threshold (y 0, i.e. b in °C) and thermosensitivity (a) of FBF (in mL dL−1 min−1 °C−1) responses using simple linear regression (y = y 0 + a * x) during the qF and qL phase for the matched eummenorrhoeic (EUM) (Lei et al. 2017) and OCP groups. The values give an indication of the central modification of the thermoeffector (skin blood flow), thus demonstrating that chronic consumption of an OCP, (quasi‐) phase and environment, causes no meaningful shift in vasodilatatory control.