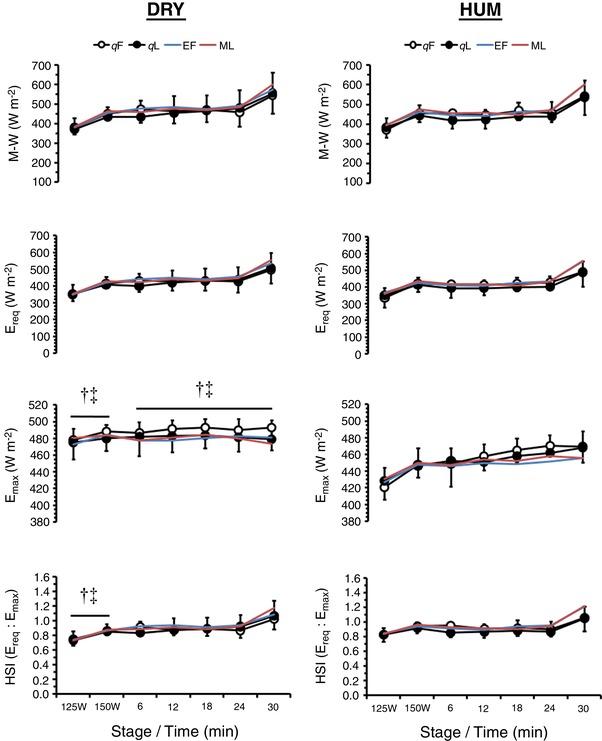
Figure 6. Mean ± SD rate of metabolic heat production (M − W, n = 10), required evaporative cooling for heat balance (E req, n = 10), maximal evaporative capacity of the environment (E max, n = 10) and HSI (n = 10) during exercise in dry (DRY) and humid (HUM) heat during the qF and qL phase.

†Significant difference between corresponding qF − HUM value. ‡Significant difference between corresponding qL − HUM value. Mean early follicular (EF) and mid‐luteal (ML) values are provided for our previous eumenorrhoeic cohort (Lei et al. 2017).
