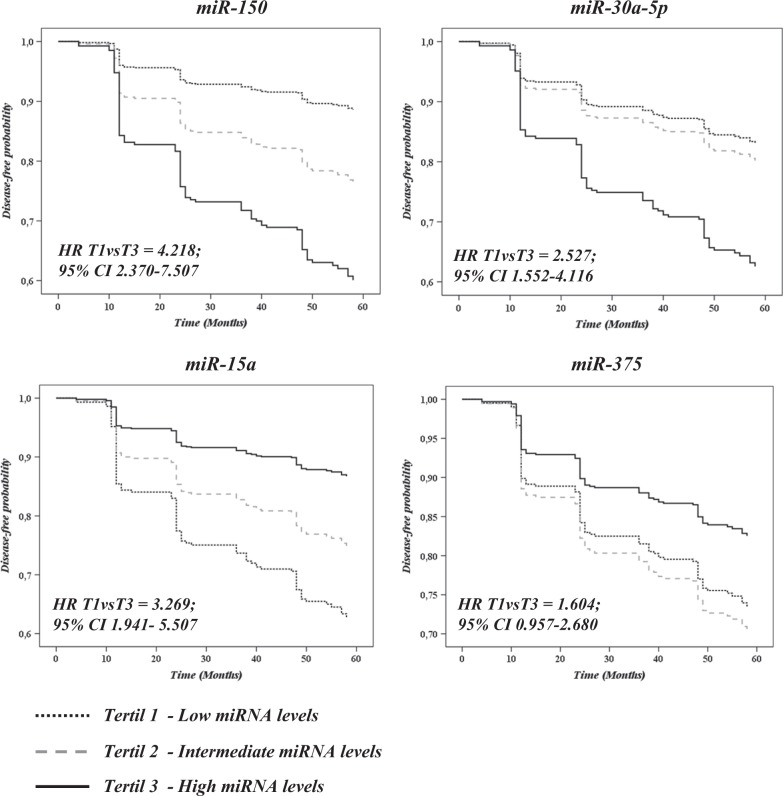
Fig. 3. Disease-free survival by COX proportional hazards regression analysis of miRNAs.
Subjects were divided into low (T1), intermediate (T2) and high (T3) baseline levels of miRNAs. The dotted black line represents subjects from T1, the dotted gray line represents subjects from T2, and the continuous black line represents subjects from T3. Analyses were adjusted for age, diet, gender, body mass index, glycosylated hemoglobin, HDL, triglycerides, and waist circumference

