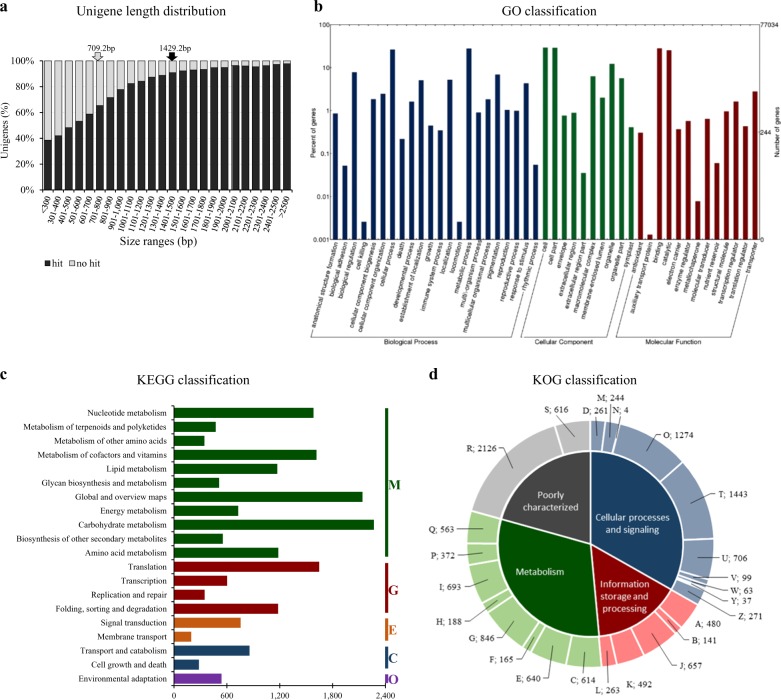
Fig. 2. C. endivia unigene length distribution and annotation.
a Unigenes distribution based on size (base pairs, bp) and BLASTX annotation. The black and gray arrows report the average length of annotated and non-annotated unigenes. b GO classification. The GO terms were classified into biological process (blue bars), cellular component (green bars), and molecular function (red bars). c KEGG classification; the histogram represents the unigene distribution into five major KEGG metabolic categories. M, metabolism; G, genetic information processing; E, environmental information processing; C, cellular processes; O, organismal systems. d Unigene functional classification into EuKaryotic Orthologous Groups (KOG). A, RNA processing and modification; B, chromatin structure and dynamics; C, energy production and conversion; D, cell cycle control, cell division, chromosome partitioning; E, amino acid transport and metabolism; F, nucleotide transport and metabolism; G, carbohydrate transport and metabolism; H, coenzyme transport and metabolism; I, lipid transport and metabolism; J, translation, ribosomal structure and biogenesis; K, transcription; L, replication, recombination and repair; M, cell wall/membrane/envelope biogenesis; N, cell motility; O, posttranslational modification, protein turnover, chaperones; P, inorganic ion transport and metabolism; Q, secondary metabolites biosynthesis, transport and catabolism; R, general function prediction only; S, function unknown; T, signal transduction mechanisms; U, intracellular trafficking, secretion, and vesicular transport; V, defense mechanisms; Y, nuclear structure; Z, cytoskeleton

