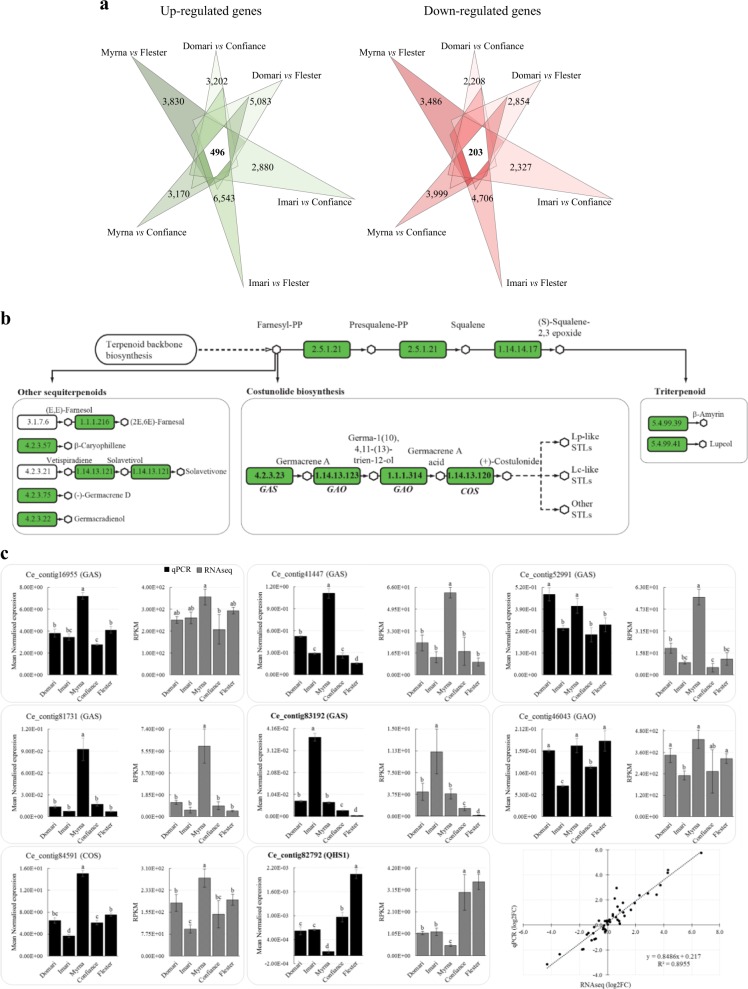
Fig. 4. Differentially expressed gene analysis and STP biosynthesis pathway.
a The Venn diagrams omit the numbers of differentially expressed genes in multiple comparisons (overlapping areas) and just report the number of up- (left) and down-regulated (right) genes specific to each comparison indicated at the vertexes. The number of genes that maintained the same differential transcription pattern in curly vs smooth cultivars (core-DEGs) is bolded. b Scheme of sesquiterpenoid and triterpenoid biosynthesis pathway in endive. Rectangles report the enzyme codes; and those assigned to endive contigs are in green (see Table 5). GAS/GAO/COS gene module acts in the costunolide synthesis branch. c Expression profiles of eight STP unigenes achieved by RNA-seq and qPCR (gray and black histograms, respectively). The unigene names in bold belong to the core-DEGs group. The last panel reports RNA-seq/qRT-PCR correlation analysis (bottom right) expressed as log2 fold change of curly vs smooth genotypes (six independent comparisons per gene); significant positive correlation occurred between the expression fold changes measured by the two methods (R2 = 0.89; P < 0.001)

