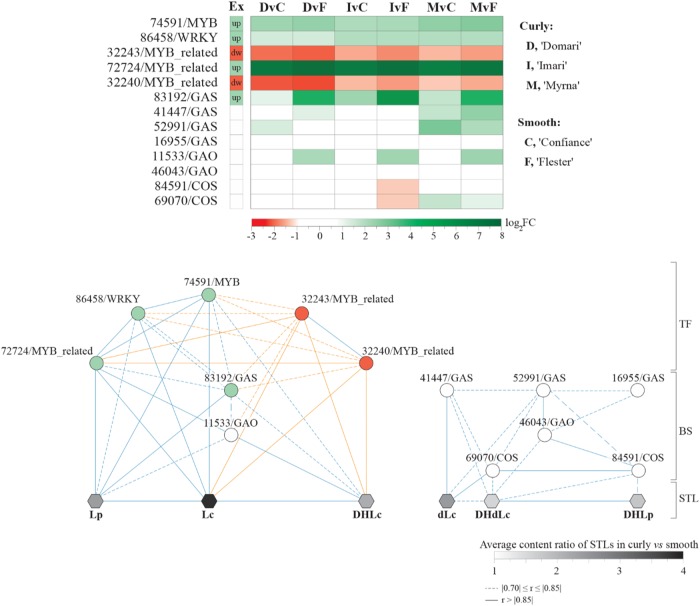
Fig. 7. Putative network subtending synthesis of Lp- and Lc-like compounds.
a Heat map visualization of the relative gene expression levels (log2 fold change) in curly vs smooth endives. The column “Ex” reports the up- or down-regulation expression pattern that was maintained in each curly vs smooth pairwise comparison (log2FC and FDR values are listed in Table S13). b Blue and orange edge represent positive and negative correlations, respectively. Solid or dashed traits refers to correlation strength according to the r coefficient ranges (bottom right). Transcription factors were sited upstream the GAS-GAO-COS biosynthesis gene module leading to sesquiterpene lactones. TF transcription factors, BS biosynthesis genes, STL sesquiterpene lactones; explanatory notes for STL abbreviations are in the legend of Fig. 6

