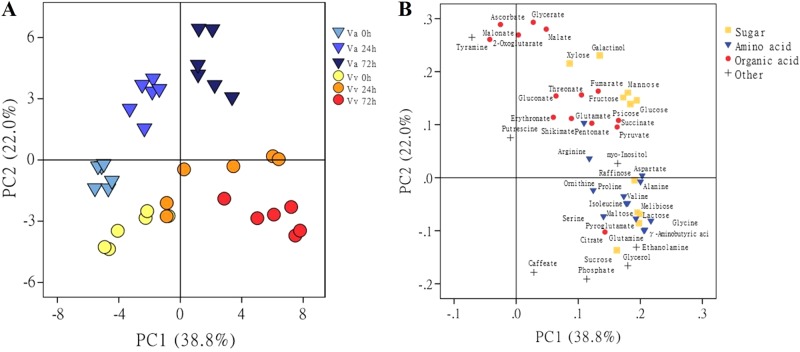
Fig. 1. Principal component analysis of metabolite profiles in leaves of V. amurensis and V. vinifera cv. Muscat of Hamburg.
Va V. amurensis; Vv V. vinifera cv. Muscat of Hamburg. Score plot (a) of samples and loading plot (b) of metabolites for the first two components, 1 (PC1) and 2 (PC2). Samples at 0, 24, and 72 h after cold treatment are represented by different shapes with colors. Each point represents an individual biological replicate in a (n = 6) and a single metabolite in b

