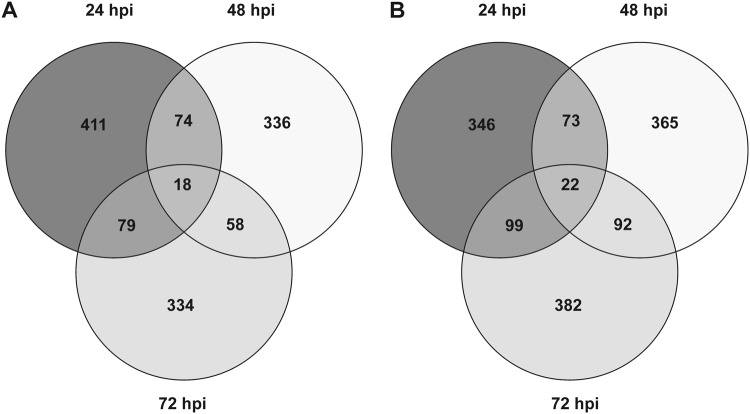
Fig. 5. Venn diagrams of tomato gene loci affected by alternative splicing in control and Trichoderma-treated roots.
Distribution of novel transcribed isoforms and/or gene features (‘intron only’, ‘multiple annotation’ and ‘internal exon extension’ categories) resulting from comparison with iTAG2.4 annotations for a control and b Trichoderma-treated root samples at 24, 48 and 72 hpi. R-SAP analysis was run with IdentityCutoff = 95 and CovCutoff = 98

