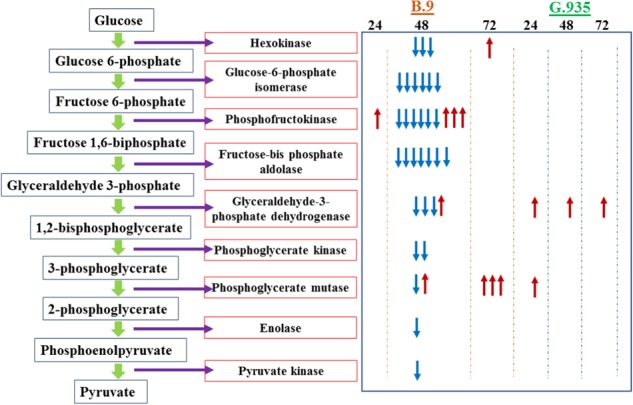
Fig. 9. Systematic suppression of genes encoding enzymes of the glycolysis pathway in apple roots.

The left panel illustrates the steps and coordinated enzymes catalyzing the reaction. The right panel indicates the identified DEGs per genotype and timepoint. Each arrow in the right panel represents an individual gene in the same gene family. Upward arrows in red color denote upregulated expression pattern; downward arrows in blue color denote downregulated expression patterns. Columns in the right panel indicate the genotypes and timepoints
