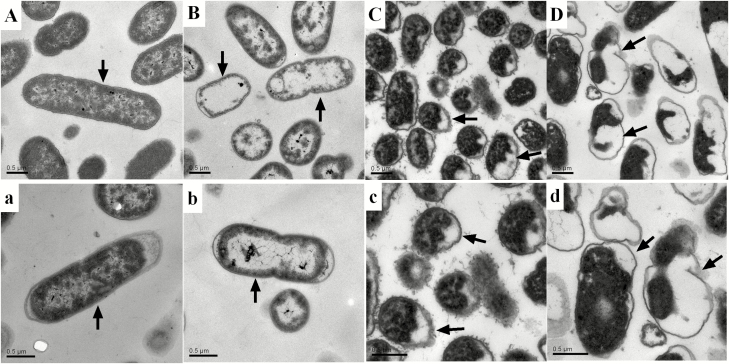
Figure 2.
Transmission electron microscopy of E. coli treated with cinnamaldehyde and citric acid. A, a represents E. coli control treated with LB after 8 h; B, b represents E. coli treated with cinnamaldehyde after 8 h; C, c represents E. coli treated with citric acid after 8 h; D, d represents E. coli treated with the combination of cinnamaldehyde and citric acid.

