Figure 4.
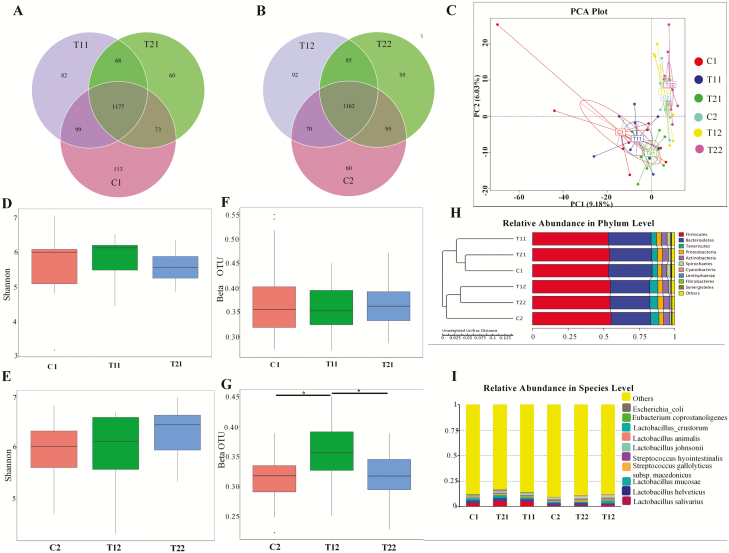
Summary of the fecal microbial communities in weaned piglets. A and B represent the Venn diagram summarizing the numbers of common and unique OTUs in the fecal microflora community of weaning piglets on day 14 and 28, respectively; C represents principle component analysis plot about the fecal microflora in weaning piglets; D and E represent the alpha diversity about the fecal microbial community of weaning piglets on day 14 and 28, respectively; F and G represent the beta diversity of the fecal microbial community in weaning piglets based on unweighted UniFrac distance on day 14 and 28, respectively; H represents the relative abundances of predominant bacteria at the phylum level in each group (unweighted UniFrac distance); I represents the top 10 relative abundance of fecal microflora community in weaning piglets (level species). C1 and C2 represents the control piglets on day 14 and 28, respectively; T11 and T12 represents the piglets supplemented with combination of essential oils and organic acids on day 14 and 28, respectively; T21 and T22 represents the antibiotics piglets on day 14 and 28, respectively. OTU, operational taxonomic unit. Each treatment with n = 10.

