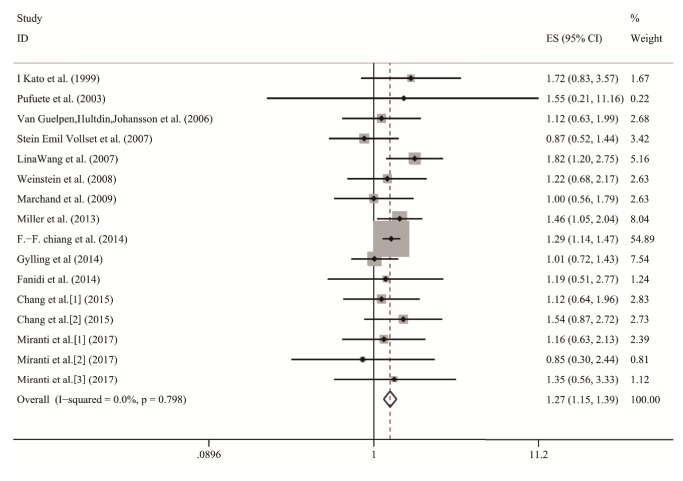
Figure 2.
Forest plot of highest versus lowest categories of homocysteine on digestive cancer risk. The squares and horizontal lines correspond to the study-specific ORs and 95% CI. The area of the squares reflects the weight. The diamond represents the summary OR and 95% CI. ORs, Odds ratios; CI, confidence interval.

