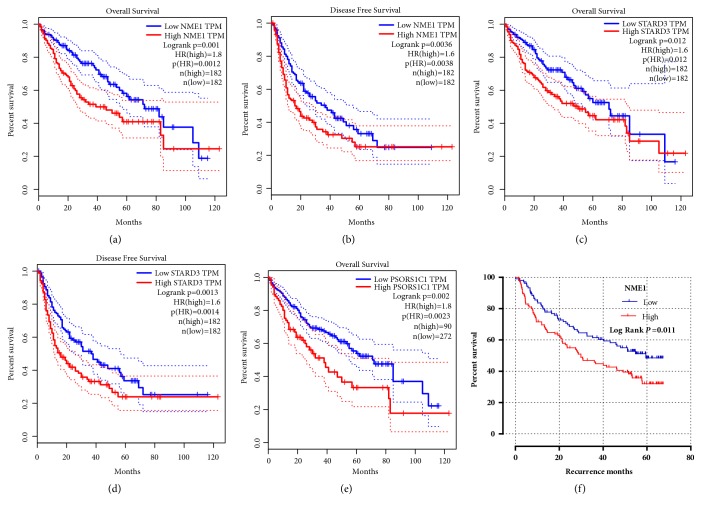
Figure 5.
Kaplan–Meier survival analysis of NM23, STARD3 and PSORS1C1 in clinical outcomes of HCC patients. (a–d) The association between NM23 and STARD3 expression level and OS of HCC patients was analyzed in GEPIA. Cutoff value was set at median. (e) The association between NM23 expression level and RFS of HCC patients was analyzed in GEPIA. Cutoff value was set at quartile. (f) The association between NM23 expression level and RFS of HCC patients was analyzed in GSE14520. Cutoff value was set at median. Statistical differences were determined by log-rank test.

