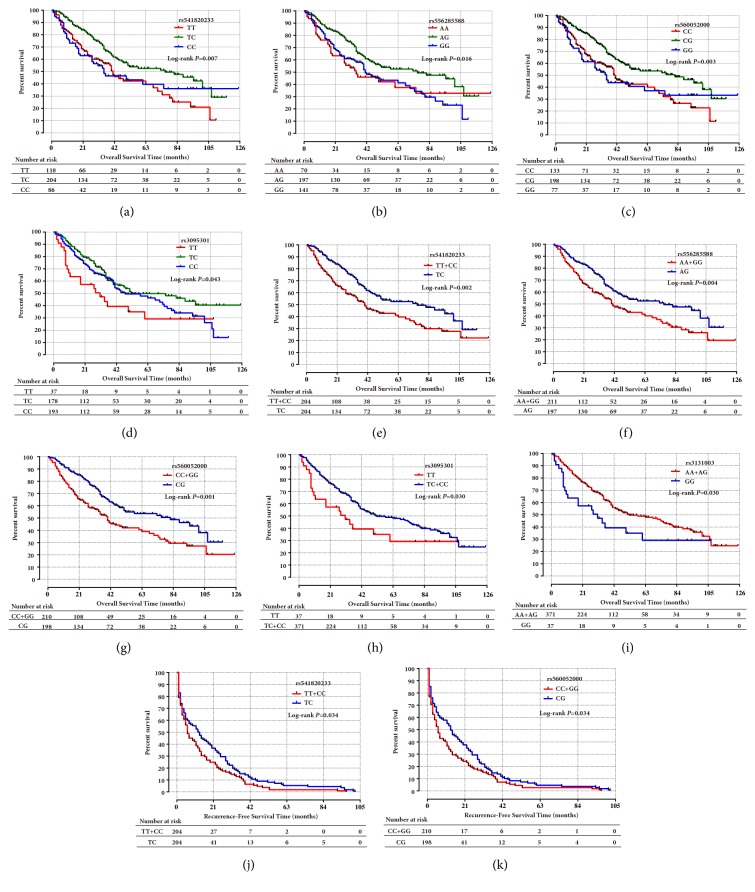
Figure 6.
Kaplan–Meier survival analysis of SNPs in PSORS1C1 (a–k) in clinical survival of HBV-related HCC patients after hepatic resection. There are statistical differences among the three groups (the genotypes of each SNP) (a–d) and two groups (the homozygote genotypes of each SNP were merged when comparing to the heterozygote genotype) (e–g, j–k). In particular, genotypes TC and CC at rs3095301 were merged (h), and genotypes AA and AG at rs3131003 were merged (i). Statistical differences were determined by log-rank test.

