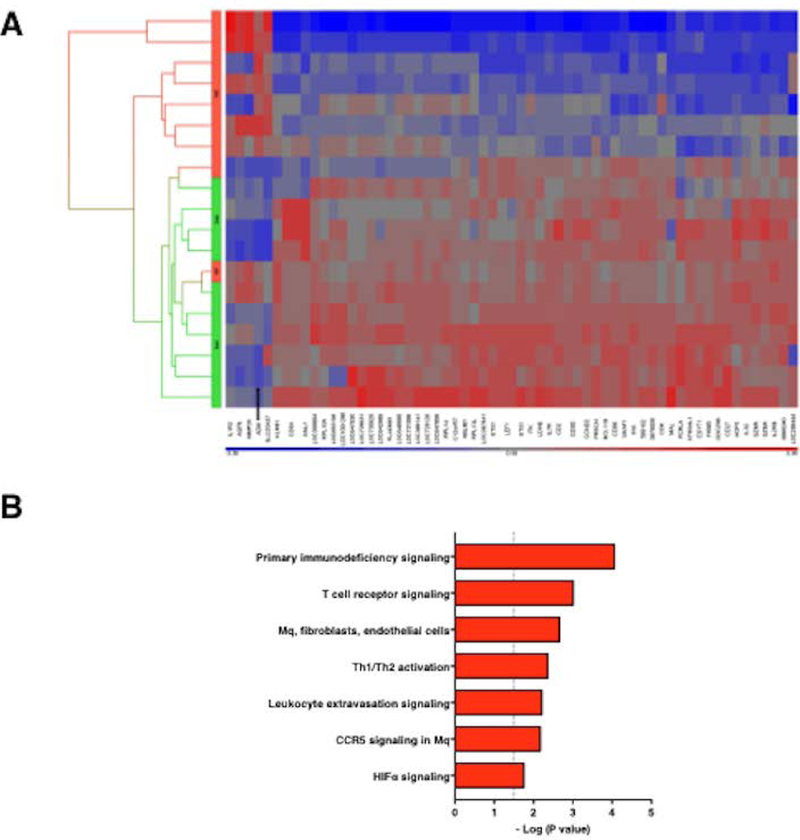
Figure 1. HeatMap of significantly altered genes in SCLS subjects during disease flares relative to disease quiescence.

(A) PBMCs from 12 SCLS subjects, obtained during either remission (basal) or acute (episodic) phases, were isolated from peripheral blood. RNA was extracted and subjected to microarray analysis as described in the Methods. 61 genes were significantly changed for at least 2.5-fold by 2-Way ANOVA, as shown in the Hierarchical Clustering HeatMap (A) (p < 0.05). y-axis is color coded to indicate basal (green) or acute episodic (red) samples. (B) Ingenuity pathway analysis of transcriptome analysis of acute vs. basal PBMCs graphed by Benjamini-Hochberg corrected p-value. Dash p=0.05; Mq=macrophage.
