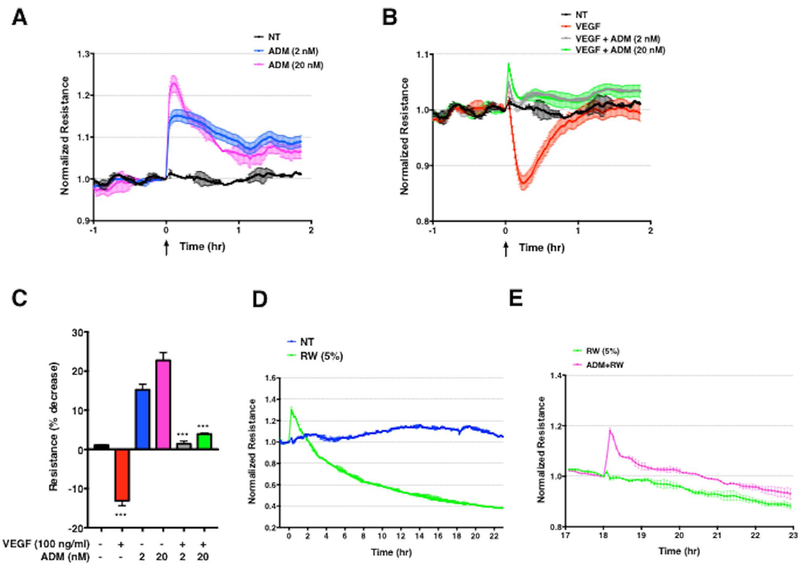
Figure 6. ADM enhances endothelial barrier function in vitro.

(A–C) Representative electrical resistance measurements across HMVEC monolayers over time following stimulation of ADM alone (A) or together with VEGF-A (B) at the indicated concentrations. NT = cells incubated with medium plus 0.2% BSA. In C, bar chart represents mean ± s.e.m. of the maximal percent decrease in resistance compared to baseline, measured in two independent experiments run in duplicate. ***p = 0.0002, one-way ANOVA, Tukey’s multiple comparisons. (D–E) Impedance measurements in HMVECs stimulated with RW medium (5% vol/vol) (D) or RW medium for 18 hours followed by application of ADM (E). Graphs are from a single experiment representative of three similar experiments.
