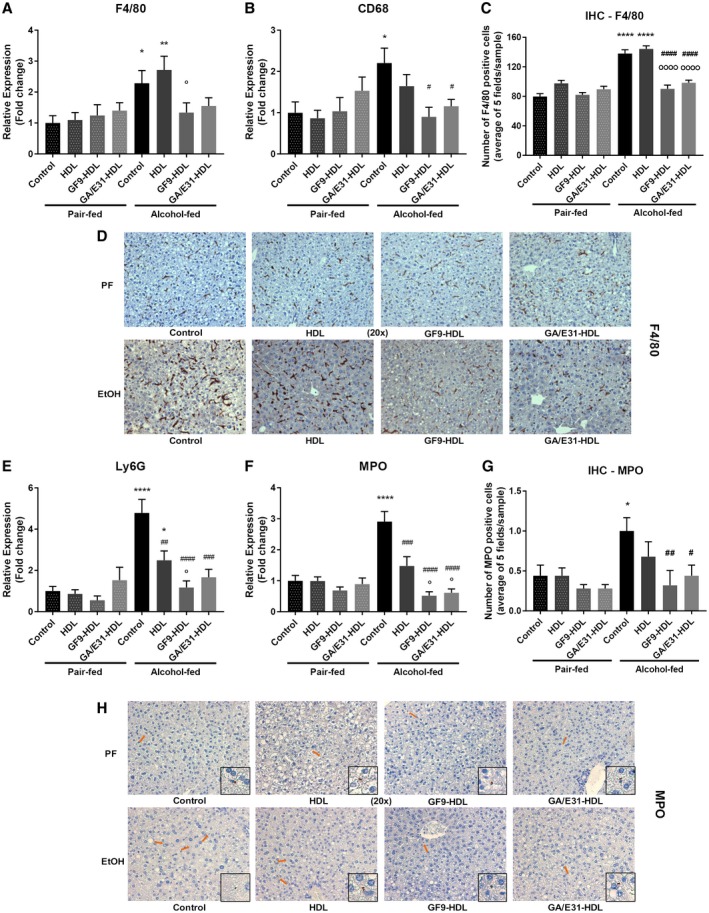
Figure 3.

TREM‐1 inhibition and markers of immune cell infiltration. [Correction made 31 October, 2018. The table title was modified to the correct description.] (A,B) TREM‐1 inhibition suppresses the mRNA expression of macrophage cell markers in the liver as measured by real‐time quantitative PCR. (C,D) Both TREM‐1 inhibitors attenuated F4/80 as shown by IHC. (E,F) TREM‐1 inhibition suppresses the mRNA expression of neutrophil cell markers in the liver as measured by real‐time quantitative PCR. (G,H) Both TREM‐1 inhibitors attenuated MPO‐positive cell infiltration as shown by IHC. * indicates significance level compared to the nontreated PF group; # indicates significance level compared to the nontreated alcohol‐fed group; o indicates significance level compared to the vehicle‐treated alcohol‐fed group. Significance levels are as follows: */#/o P ≤ 0.05; **/## P ≤ 0.01; ### P ≤ 0.001; ****/#### P ≤ 0.0001.
