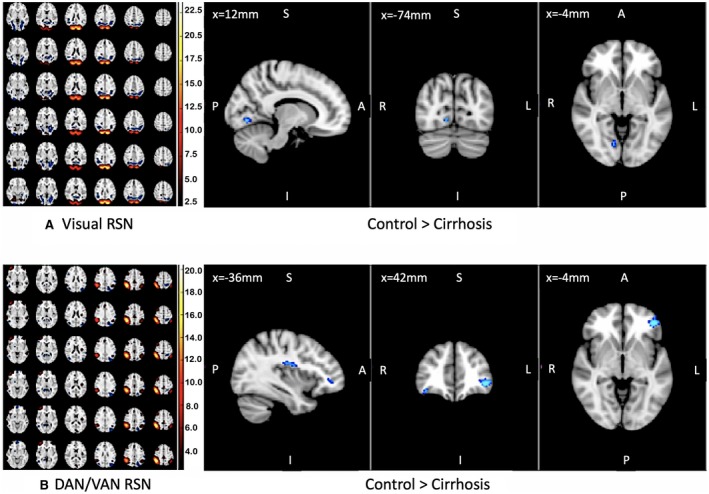
Figure 2.

Resting state network analysis. Significant differences in visual and attentional RSNs in control compared to patients with cirrhosis are shown. On the left, we show group‐level RSNs corresponding to visual and attentional networks. Blue areas on the right correspond to areas of the brain that have greater functional connectivity to visual RSN (top) and attentional RSN (bottom) in controls compared to elderly patients with cirrhosis. None of the RSNs were higher in patients with cirrhosis compared to controls. Scale is Z‐transformed independent component coefficients.
