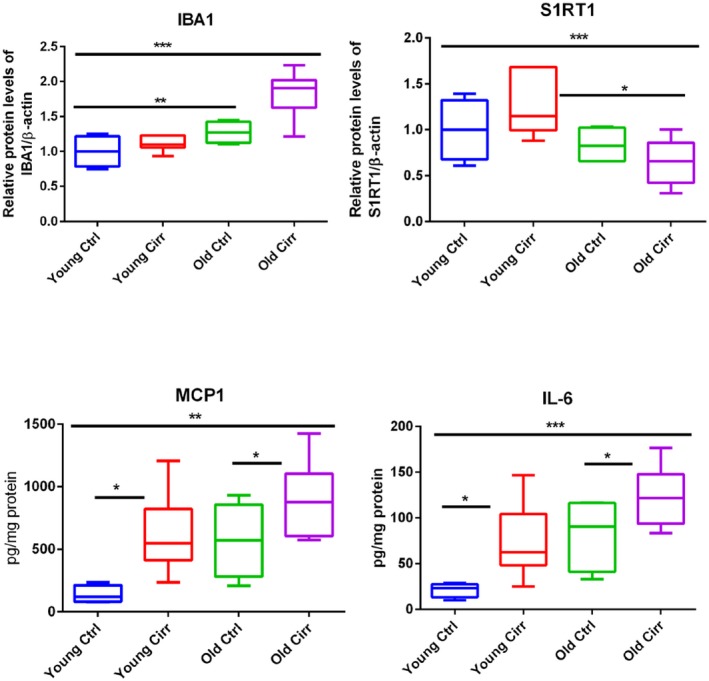
Figure 4.

ELISA and western blot changes. Comparisons among the four mouse groups. Data presented in the graphs are median and 95% CI. *P < 0.05, **P < 0.01, ***P < 0.001 indicate significant differences by the Mann‐Whitney or Kruskal‐Wallis test. Abbreviations: Cirr, cirrhosis; Ctrl, control; S1RT1, sirtuin‐1.
