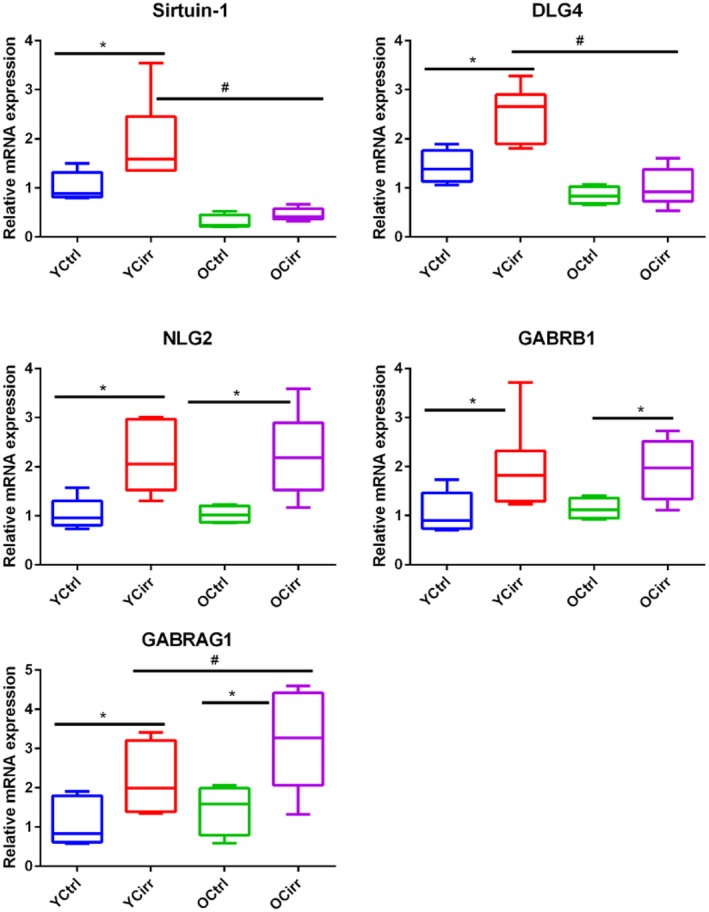
Figure 5.

Cortical synaptic plasticity and GABA receptor expression. Comparisons among the four mouse groups. All data are presented as median and 95% CI. * indicates significant differences by the Mann‐Whitney test between cirrhotic and noncirrhotic mice in the same age group; # indicates significant differences by the Mann‐Whitney test between cirrhotic mice in different age groups. Abbreviations: OCirr, old cirrhosis; OCtrl, old control; YCirr, young cirrhosis; YCtrl, young control.
