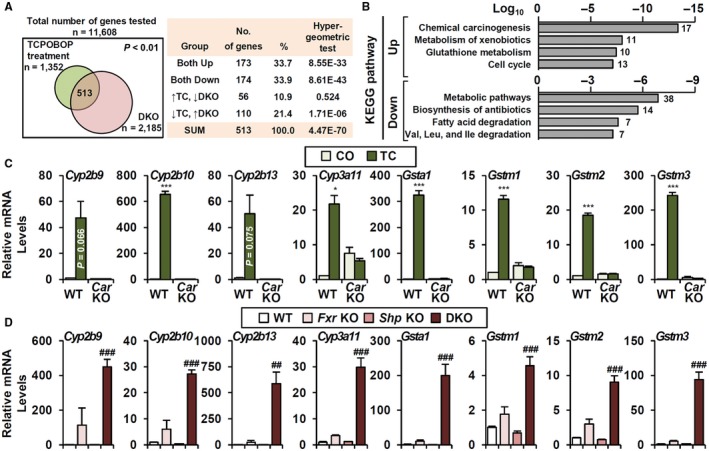
Figure 1.

DKO gene signature indicates potential CAR activation. (A) Comparison of DKO and TC‐treated liver microarrays. Among 513 genes that were significantly changed in both microarrays, 347 genes (173 + 174, 67.6%) were regulated in the same manner. (B) KEGG pathway analysis of 347 genes; the top four gene categories in each analysis are shown. (C,D) Representative CYP and GST gene expressions (C) by TC treatment in WT and Car knockout (n = 4) as well as (D) in Fxr knockout, Shp knockout, and DKO (n = 3‐6). Student t test, *P < 0.05, ***P < 0.005 compared to CO‐treated WT. ANOVA followed by Tukey HSD; ##P < 0.01, ###P < 0.005. In some cases, the actual P value is presented.
