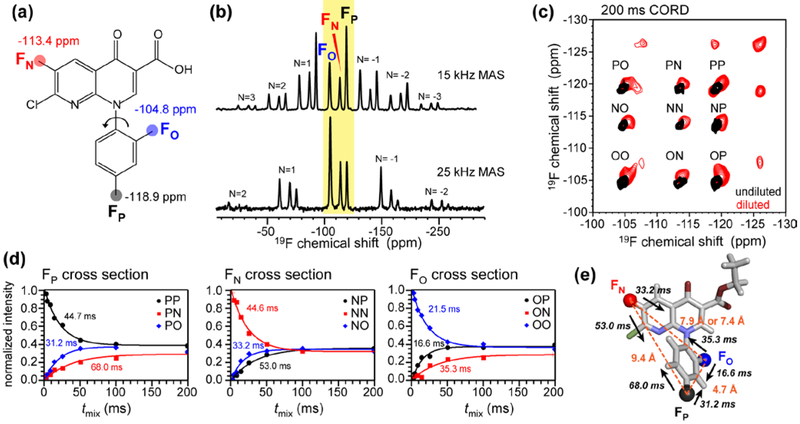
Figure 4.
19F spin exchange of PNC. (a) Chemical structure of PNC, indicating the isotropic chemical shifts of the three fluorines. (b) 19F CP spectrum at 15 kHz and 25 kHz MAS. Centerband peaks (N = 0) are shaded in yellow. Significant sideband intensities (N ≠ 0) are seen at 15 kHz MAS. (c) 2D 19F–19F correlation spectrum measured using 200 ms CORD for undiluted (black) and 1 : 5 diluted (red) PNC. Additional peaks in the diluted spectrum result from perturbation by the diluting compound Trp, and are not analyzed. (d) Normalized intensities of cross peaks and diagonal peaks as a function of mixing time. Best-fit exponential time constants tSD = 1/kSD are indicated. (e) Polarization exchange time constants for the 19F–19F distances in the molecular structure of PNC.

