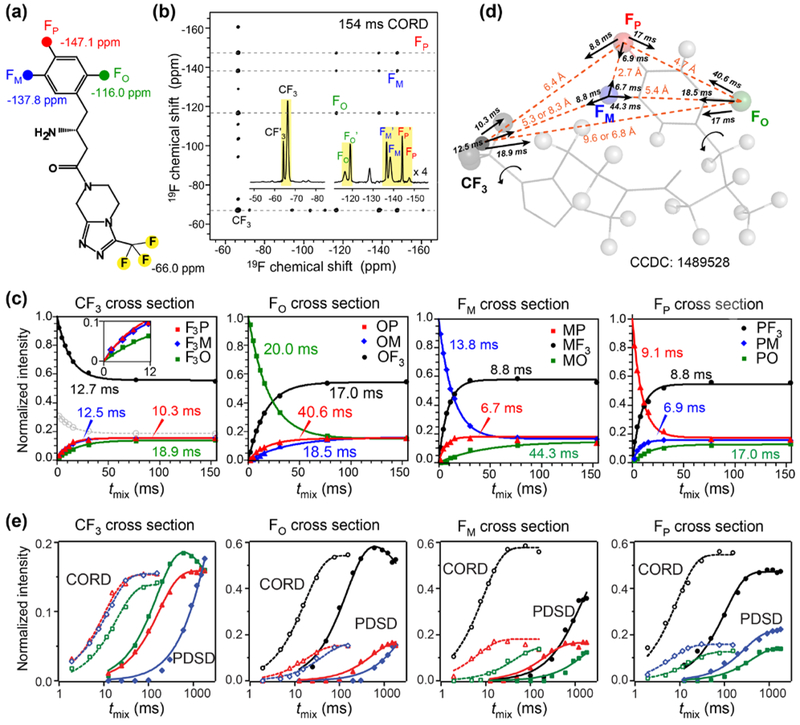
Figure 5.
19F spin exchange data of sitagliptin. (a) Chemical structure of sitagliptin and 19F isotropic chemical shifts. (b) 2D 19F–19F correlation spectrum of diluted sitagliptin, measured under 25 kHz MAS using 154 ms CORD mixing. Inset: 19F direct polarization spectrum at 35 kHz MAS. Assignment for the set of 19F signals that show correlation peaks is given. (c) Normalized intensities of cross peaks and diagonal peaks as a function of CORD mixing time. (d) Best-fit spin exchange time constants for the 19F–19F distances in sitagliptin69. Protons are shown as gray spheres. (e) Comparison of CORD (open symbols) and PDSD (filled symbols) 19F spin exchange buildup curves plotted on a logarithmic time axis. CORD spin exchange is much faster than PDSD. Intensity drops at long PDSD mixing times result from T1 relaxation.

