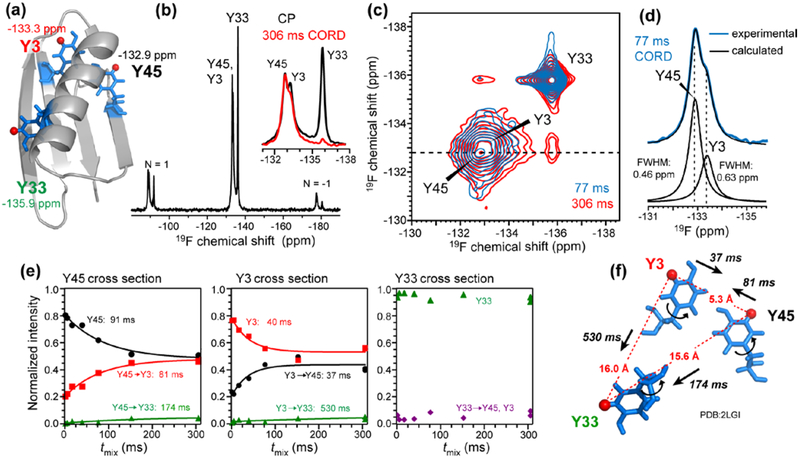
Figure 7.
19F spin exchange of 3F-Tyr-GB1. (a) GB1 structure (PDB: 2JSV63) and the 19F isotropic chemical shifts. (b) 19F CP spectrum at 25 kHz MAS. Inset: isotropic peaks from the 19F CP spectrum (black) overlaid with the Y45 cross section (−132.9 ppm) of the 306 ms 2D CORD spectrum (red). (c) 2D 19F–19F correlation spectra with 77 ms (blue) and 306 ms (red) mixing. (d) Peak deconvolution of Y45 and Y3. (e) Normalized intensities of cross peaks and diagonal peaks as a function of mixing time. (f) 19F spin exchange time constants of –the three 19F sites for the 19F–19F distances in GB1. The distances are the average distances for 3-19F and 5-19F positions.

