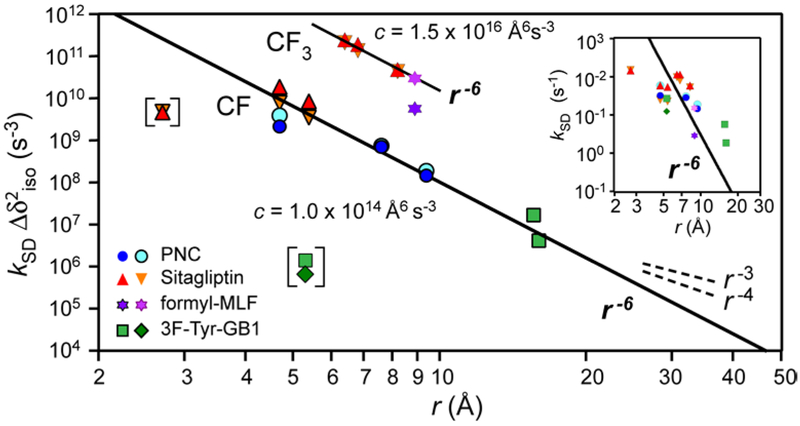
Figure 8.
Chemical-shift modified spin exchange rates as a function of 19F–19F distances. Two buildup rates are observed per spin pair. Solid lines have a slope of –6 to indicate the 1/r 6 dependence, cf. Eq. (7). CF–CF spin exchange has a distinct and smaller proportionality constant c than CF–CF3 spin exchange, but both show the 1/r6 dependence. Data points in brackets are expected outliers, to which the chemical-shift correction does not apply; see main text and Supporting Information.

