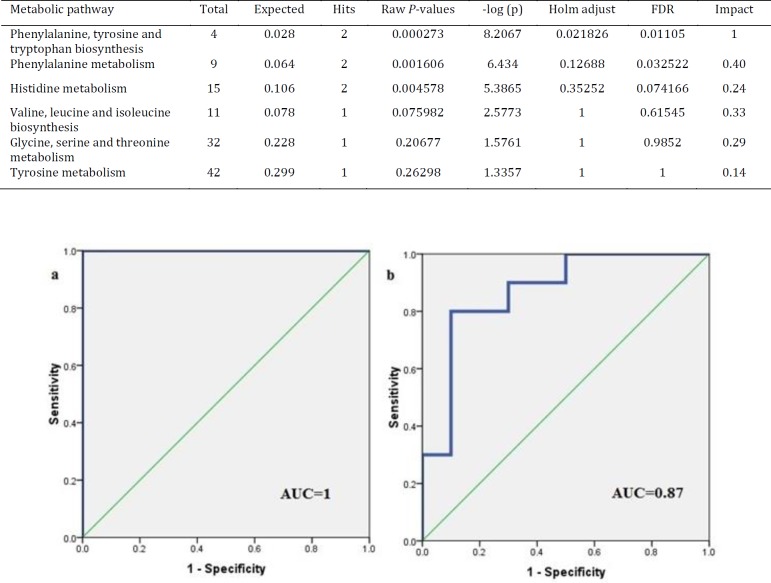
Figure 4.
Validation of multivariate models of NMR data. (a) Receiver operating characteristic (ROC) curve analysis of the predictive power of serum biomarkers for distinguishing Alzheimer’s disease (AD) from controls using orthogonal projections to latent structures-discriminant analysis (OPLS-DA model). (b) ROC curve analysis for the predictive power of serum biomarkers for distinguishing AD from the treated - group using OPLS-DA

