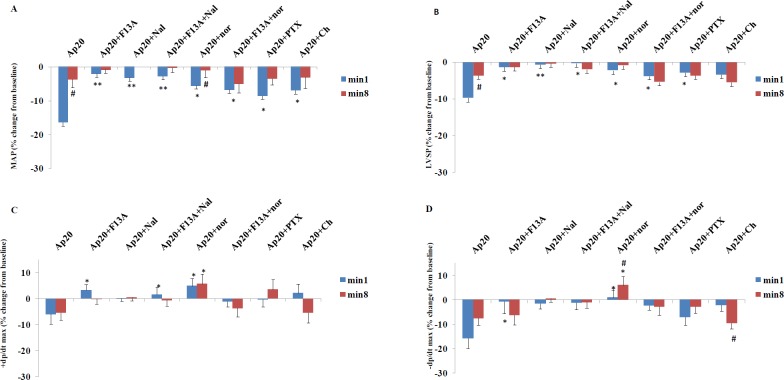
Figure 4.
Changes in MAP, LVSP and ±dP/dt max from baseline at min 1 and 8 in response to apelin 20 µg/kg in different groups of the study (n=8 in each group). Saline or antagonists/inhibitors were administered 10 minutes before apelin injection. MAP: mean arterial pressure, LVSP: left ventricular systolic pressure. *=P<0.05, **=P<0.01 vs. apelin at the same time point. #=P<0.05 min 1 vs min 8 of the same group

