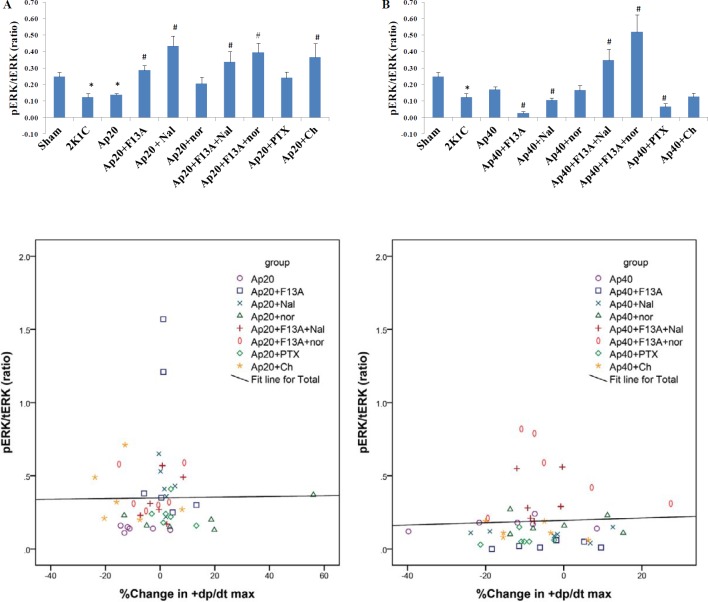
Figure 9.
PERK /tERK ratio in the groups receiving apelin 20 (A) or apelin 40 (B). Scatterplot with fitted regression lines showing the relationship between % change in +dp/dt max and PERK 1/2 in apelin 20 groups (C) and apelin 40 groups (D). n=6 for each group. PERK: phosphorylated extracellular signal–regulated kinases, tERK: total ERK. Ap20: Apelin 20 µg/kg, Ap40: Apelin 40 µg/kg, Nal: Naloxone, nor: nor-BNI, Ch: Chelerythrine. * = P<0.05 vs. Sham, # = P<0.05 vs apelin 20 or apelin 40 µg/kg

