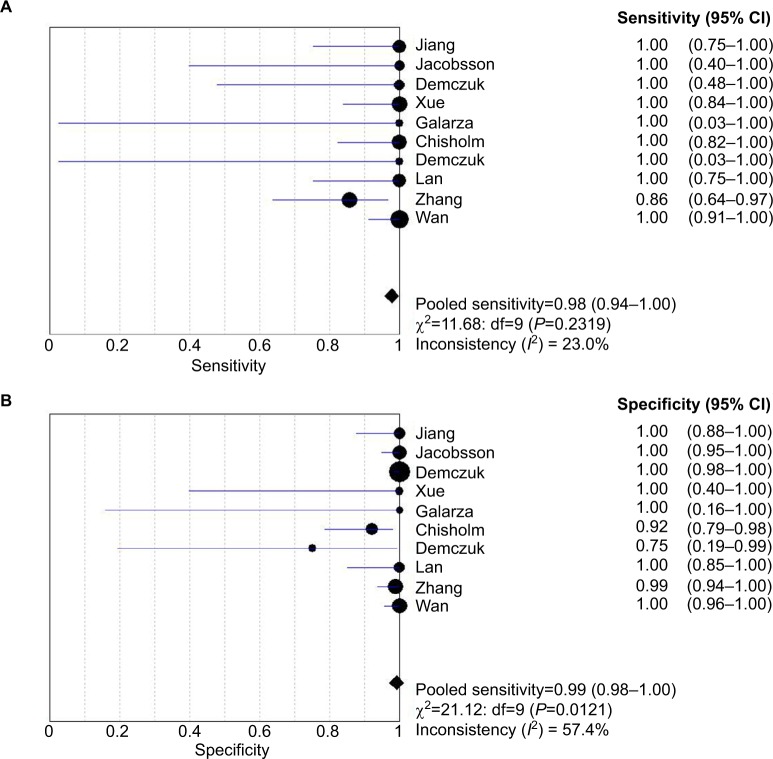
Figure 2.
Analysis of sensitivity and specificity rates from included studies. Forest plot of sensitivity of the molecular assays in (A) and specificity in (B).
Notes: Point estimates of sensitivity and specificity from each study are shown as solid square. Error bars indicate 95% CI. Diamond is the estimated rates of pooled studies.

