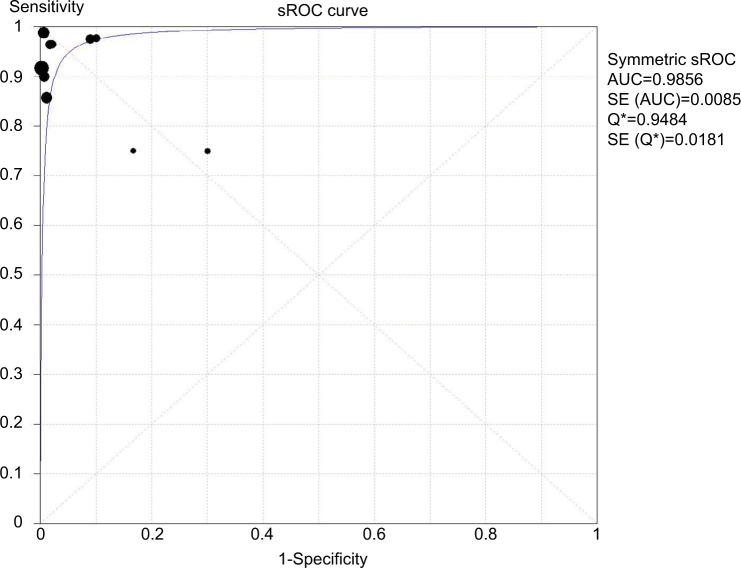
Figure 3.
sROC curve of ten studies with both sensitivity and specificity rates.
Notes: The size of each solid square represents the sample size of individual study. The regression sROC curve summarizes the overall diagnostic accuracy.
Abbreviations: AUC, area under the curve; SE, standard error; sROC, summary receiver operating characteristic.

