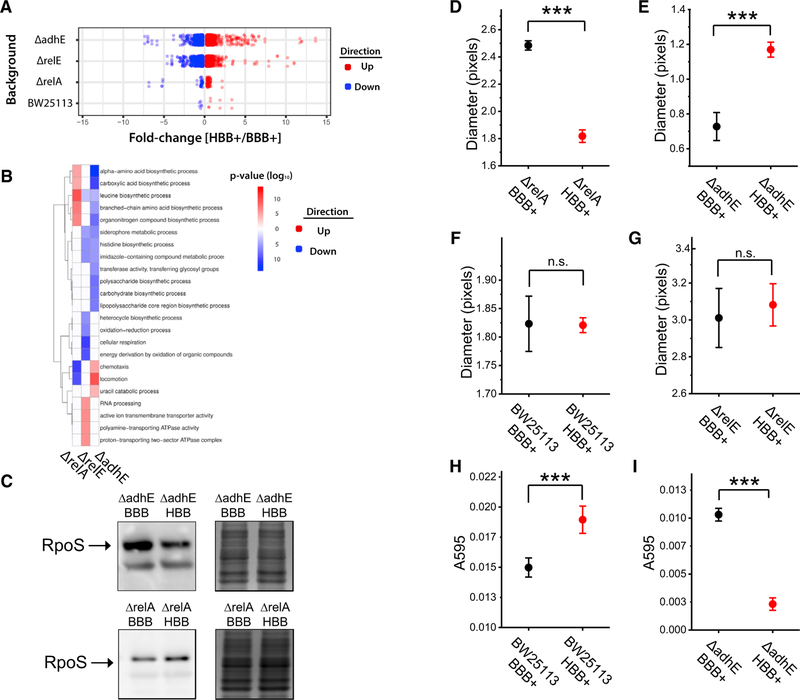
Figure 4. Functional Linkages between the Ribosome Head Domain Protein Factors RelA, RelE, and AdhE Regulate Gene Expression and Phenotype.
(A) RNA-seq analysis of Keio parent strain (BW25113) or isogenic strains lacking relA, relE, or adhE genes. The compared strains are identical except for the ten nucleotide variants encoded by the pKK3535-BBB and pKK3535-HBB rDNA plasmids. All experiments were performed on isolated polysome fractions in biological triplicate.
(B)Gene ontology enrichment analysis of differentially expressed genes from (A).
(C) Quantification of RpoS protein levels measured by western blot and normalized to total protein (n = 5). Representative blot and loading control of total protein visualized by the Colloidal Blue Staining Kit are shown.
(D–I) The impacts of ribosome sequence variation on (D–G) cell motility and (H and I) biofilm formation. Genetic backgrounds are listed on the x axis. Error bars indicate SEM. *** indicates p < 0.01.

