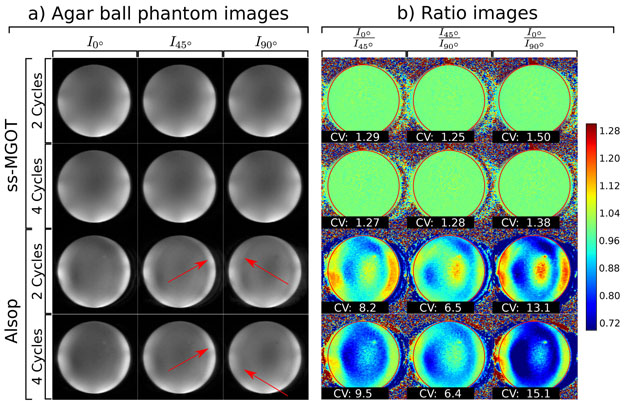
Figure 6:
(a) T2 weighted images of an agar phantom ball where the diffusion lobes amplitudes are set to zero. In each case, the phase of the initial 90° excitation pulse was varied from 0° to 90° to demonstrate the insensitivity against the initial phase for each method. Two different versions of each sequence were tested with 2 and 4 cycles of dephasing/rephasing on Gz. (b) Ratio images between the different excitation phase images for each case are presented with the same window and level (see colorbar). Coefficients of variation are calculated for the highlighted ROI and are displayed over each respective ratio image.

