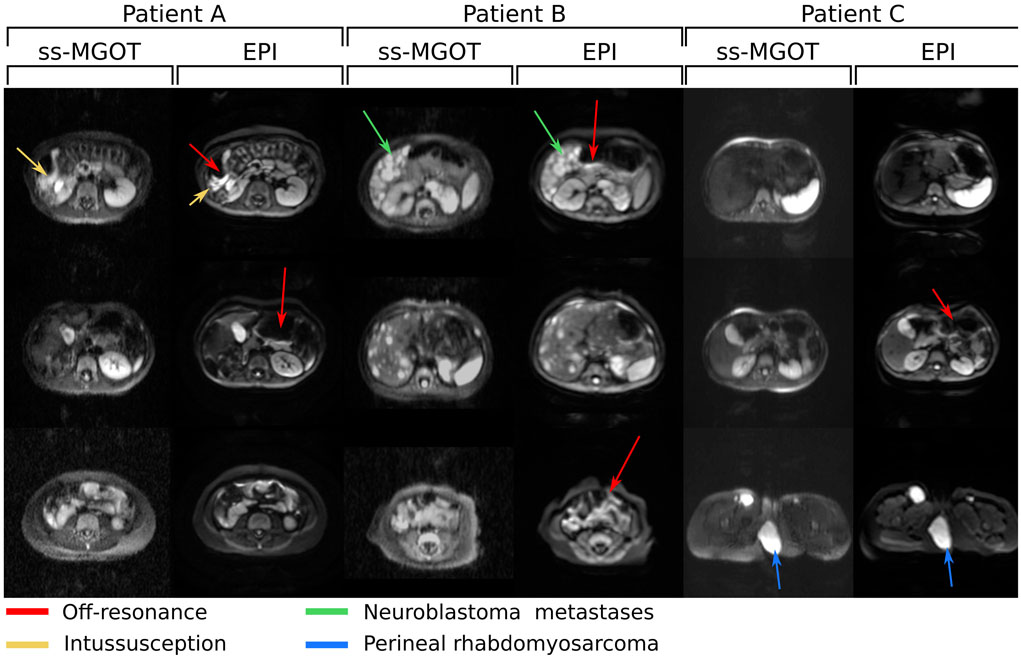
Figure 9:
Clinical abdomen/pelvis protocol in vivo images with b = 500 s ⋅ mm−2 diffusion encoding. Three different sets of patient images are shown. EPI and ss-MGOT images are compared at various slice locations. In these images, the red arrows highlight areas of off-resonance seen in the EPI images. The yellow arrow highlights areas of distortion caused by bowel gas from an intussusception. The green arrow highlights a neuroblastoma metastases in the liver. The blue arrow highlights a perineal rhabdomyosarcoma.

