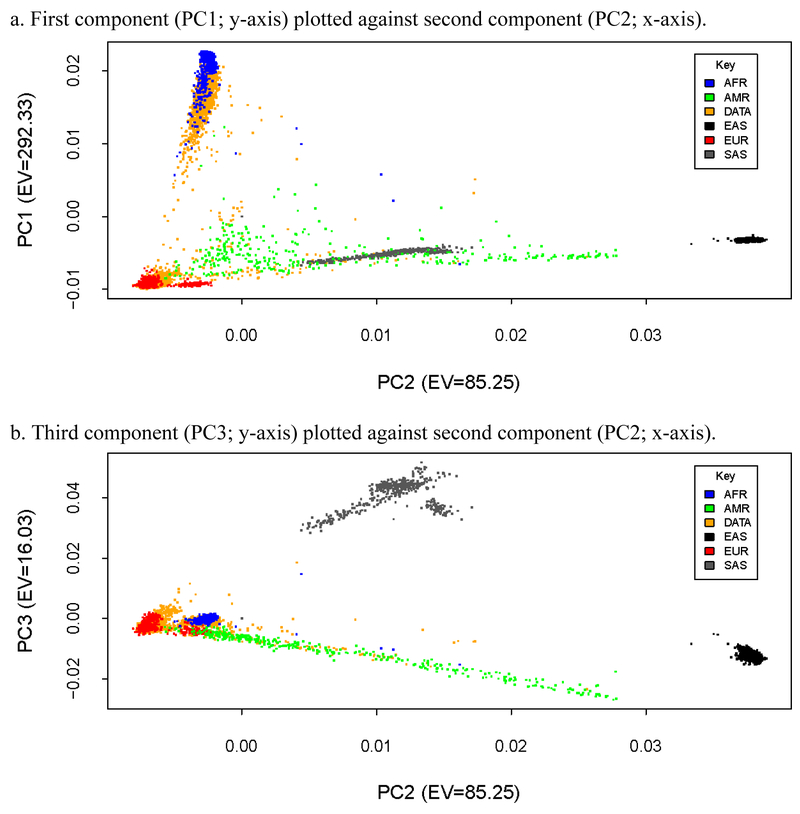
Figure 2.
Scatterplots of genetic principal components of the SAGE sample data plotted with 1000 Genomes Reference Panel ancestral groups data.
Note: EV = eigenvalue; 1000 Genomes Referance Panel ancestral groups included: AFR = African; AMR = Americas; DATA = SAGE sample data; EAS = East Asian; EUR = European; SAS = South Asian.

