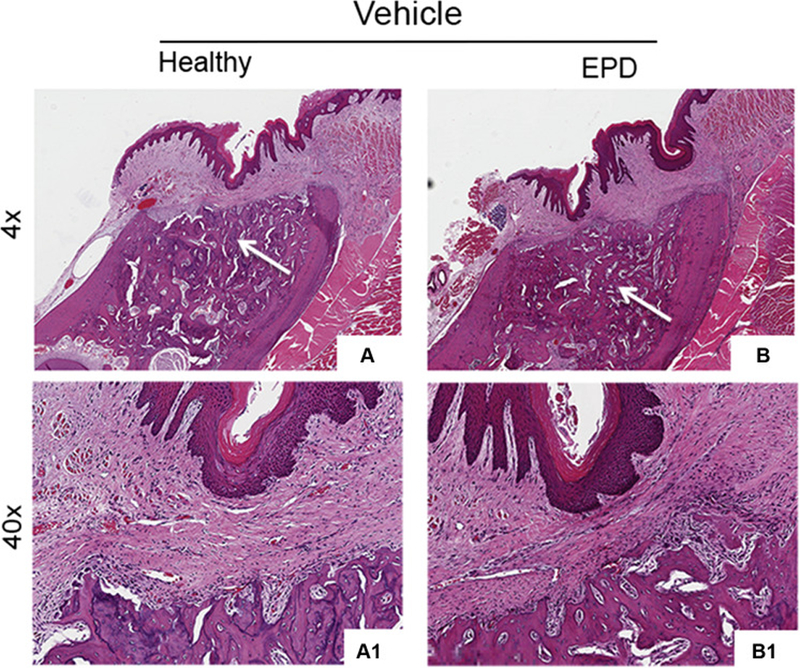
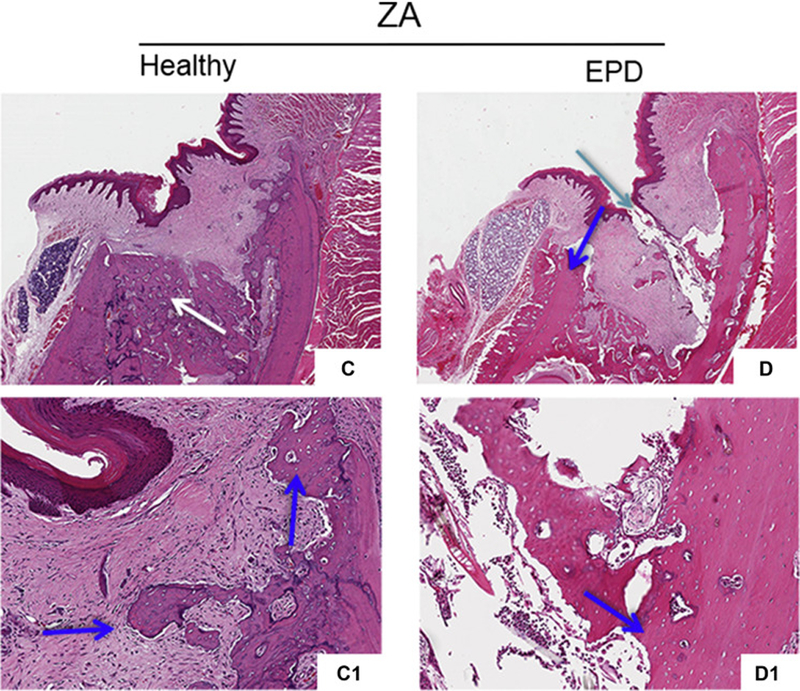
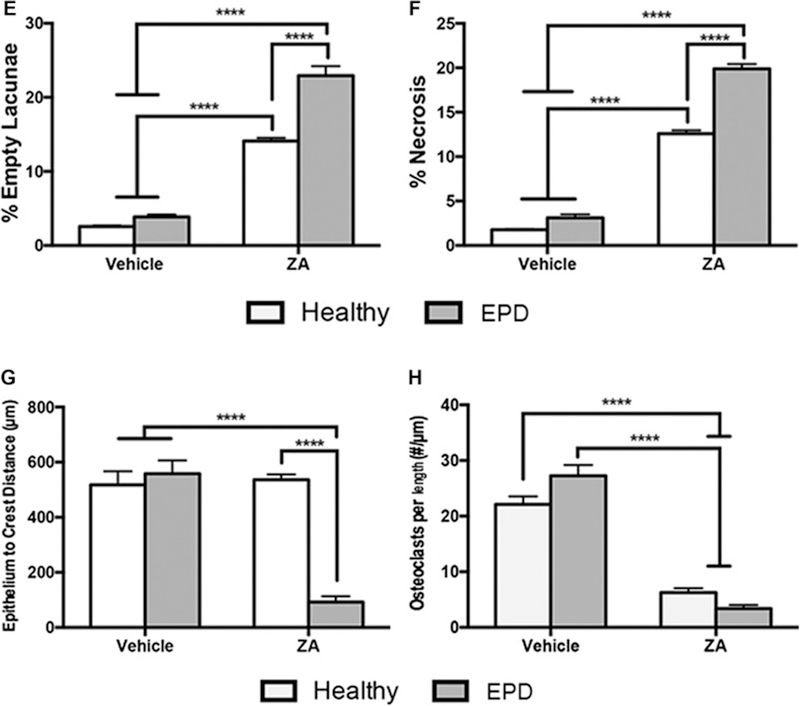
Fig. 5. Histologic evaluation of extraction sockets following extraction.


Representative H&E sections of extraction sockets in vehicle treated animals with extraction of healthy teeth (a, a1) and teeth with EPD (b, b1). White arrows point to areas of woven bone formation. H&E sections of extraction sockets in ZA treated animals with extraction of healthy teeth (c, c1) and teeth with EPD (d, d1). Blue arrows point to areas of osteonecrosis. Cyan arrow points to mucosal defect, debris and bone exposure. Quantification of (e) percent empty osteocytic lacunae, (f) percent osteonecrosis, (g) epithelium to crest distance, and (h) osteoclasts/length. Data represents mean value ± SEM. **** statistical significance, p<0.0001 (n=15 per group).
