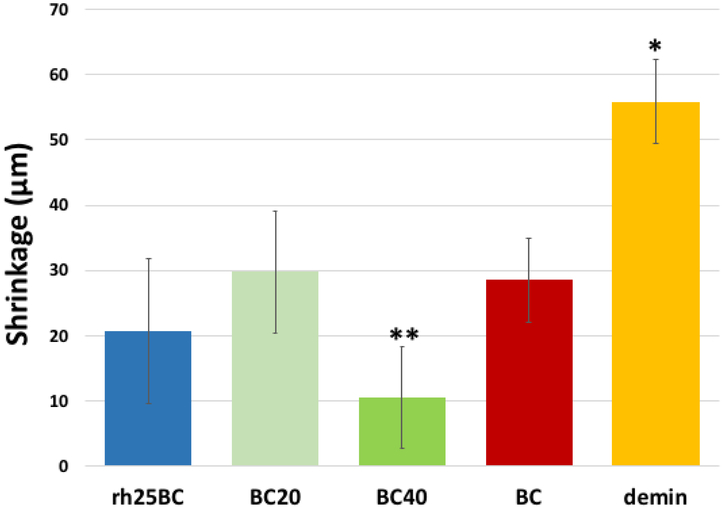
Fig. 3: Dehydration shrinkage.
Plot of average shrinkage values of the demineralized zone when fully dehydrated after restorative treatment and 14 days of remineralization. All specimens showed reduced shrinkage compared to the demineralized specimens (*). In addition, shrinkage of BC40 (**) was significantly lower (ANOVA p<0.047) compared to all other treatment groups.

