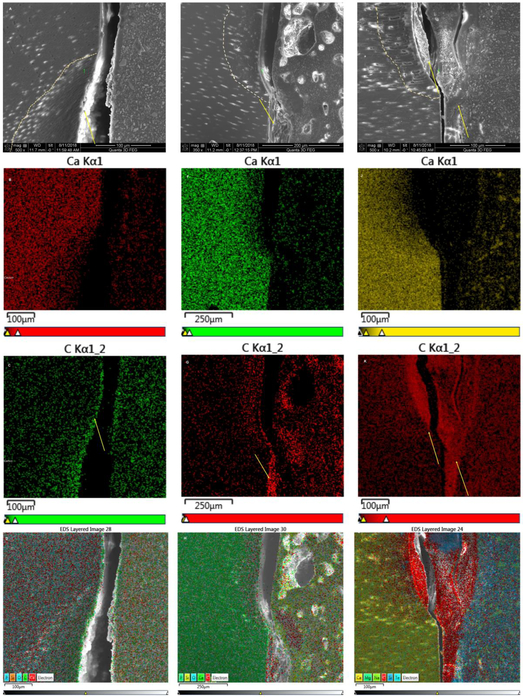
Fig. 6: SEM-EDS-analysis by elemental mapping.
Distribution of the concentration of the elements Calcium and Carbon and mixed elements are depicted as a function of location across the dentin-cement interface after restoration with BC (A to D); BC40 (E to H) and rh25BC (I to L), after 14 days of remineralization in SBF. SEM-micrographs (A, E, I); Calcium distribution (B, F, J); Carbon distribution (C, G, K); and distribution of all elements detected (D, H, L), show a reaction layer that predominantly consists of carbon.

