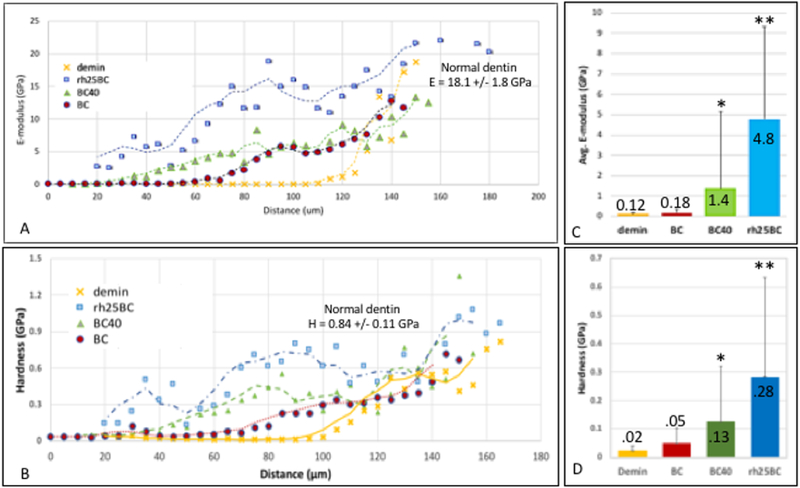
Fig. 7: Elastic modulus line profiles.
A) Nanoindentations were placed from the top of the lesion towards sound dentin along two lines separated by a 4 μm spacing, and average modulus is plotted using values for those 2 line profiles on all three specimens (n = 3). Sample groups BC, BC40 and rh25BC after 2 weeks of remineralization are compared to demineralized dentin. B) Average values of E-moduli within the outer 60 μm of the lesion after remineralization treatment with BC, BC40 and rh25BC compared to demineralized lesion.

