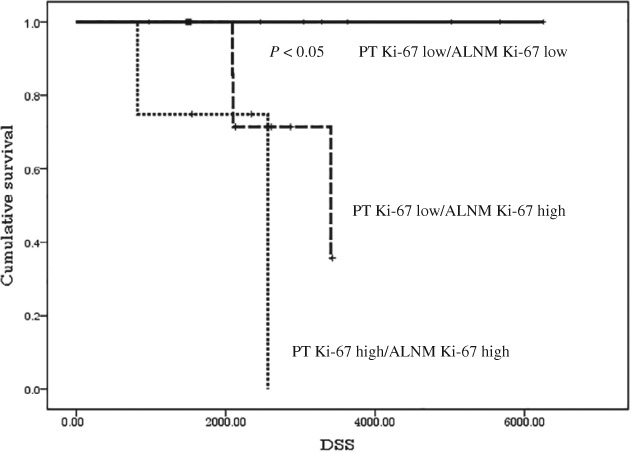
Figure 3.

Kaplan–Meier disease‐specific survival curves stratified subjects into four groups by the primary tumor (PT) and metachronous axillary lymph node metastasis (ALNM) Ki‐67 labeling indices, according to the optimal cutoff values. ( ) PT Ki‐67 high/ALNM Ki‐67 low.
