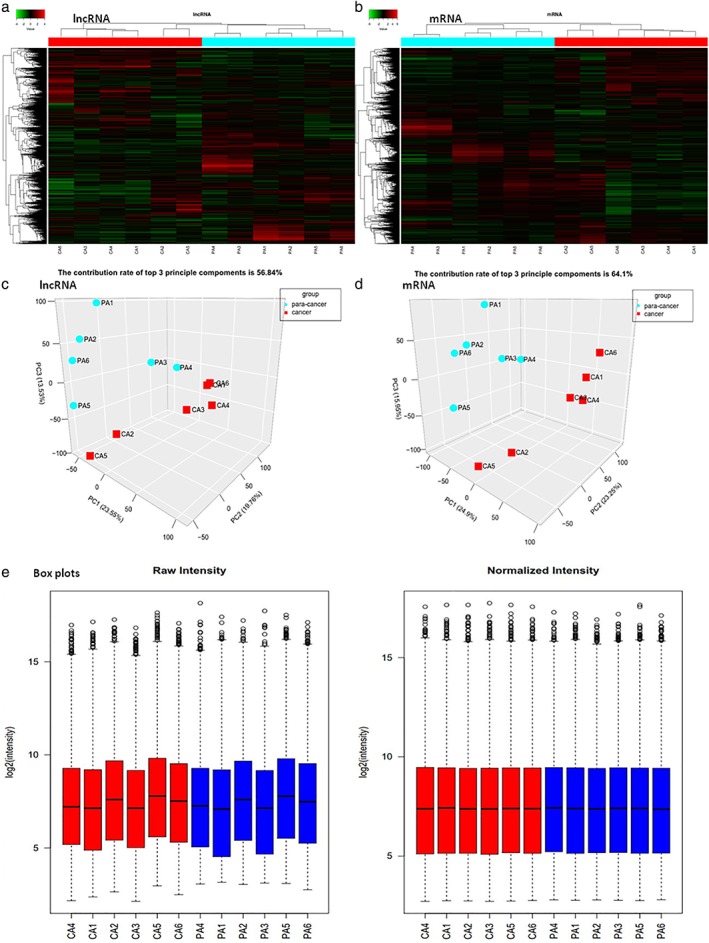
Figure 1.

Plots of the microarray analysis data of the samples. Hierarchical cluster analysis plots of the expression of (a) long non‐coding RNAs (lncRNAs) and (b) messenger RNAs (mRNAs) in esophageal squamous cell carcinoma (ESCC) and para‐cancer tissues show good similarities among cancer tissues and among para‐cancer tissues, respectively. Red denotes high relative expression and green denotes low relative expression. Each RNA is represented by a single row of colored boxes and each sample by a single column. The three‐dimensional principal component analysis plots for normalized data of (c) lncRNAs and (d) mRNAs of the samples, respectively, shows good similarities among cancer tissues and among para‐cancer tissues. Groups ( ) para‐cancer and (
 ) cancer. (e) The box plots for overall gene expression level in each sample before and after normalization show overall gene expression levels among all samples tended to be the same after normalization.
