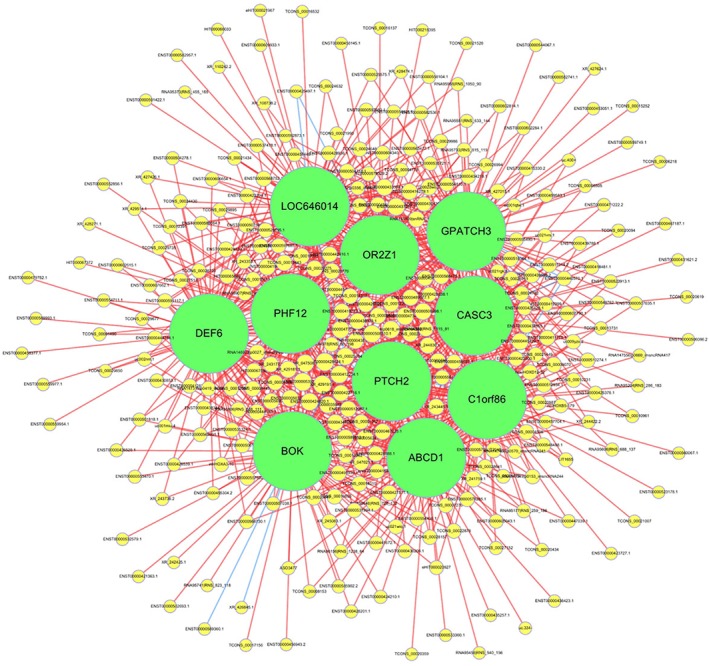
Figure 5.

The coding‐non‐coding gene co‐expression network. This network was constructed with the top 1000 significant long non‐coding RNA (lncRNA)‐messenger RNA (mRNAs) pairs with Pearson correlation coefficients > 0.95. Yellow circles represent lncRNAs, green circles represent mRNAs, red lines represent positive correlation, and blue lines represent negative correlation. The size of the circle in the network represents a gene “degree,” defined as the number of times one specific gene is linked to other genes.
