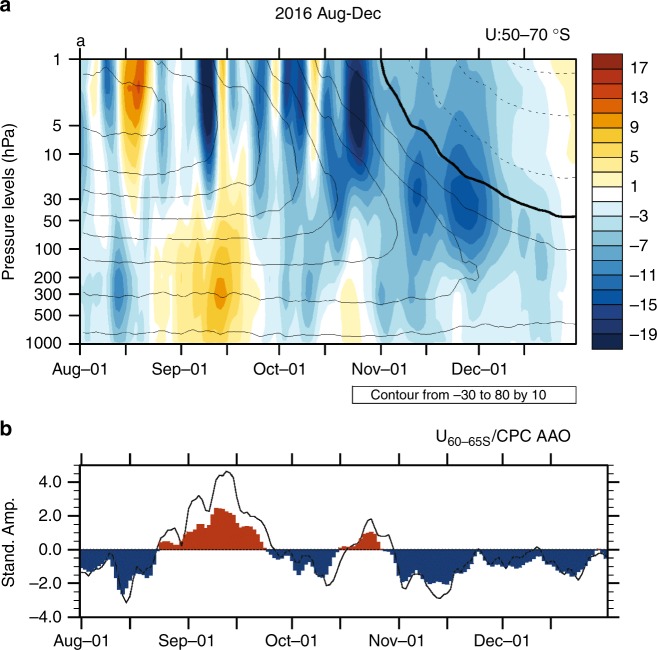
Fig. 4.
Daily anomalies of Antarctic circulation in August to December 2016. a Zonal mean zonal wind anomalies averaged 50–70˚S (shading, m s−1) superimposed with climatological zonal mean zonal wind (contour interval 10 m s−1, easterly values dashed, and zero contour thickened). b Standardised amplitudes of the daily U60–65S index (shading) and the NOAA CPC Antarctic Oscillation index that represents SAM (curve). Plots were generated using the NCAR Command Language version 6.4.0 (www.ncl.ucar.edu)

