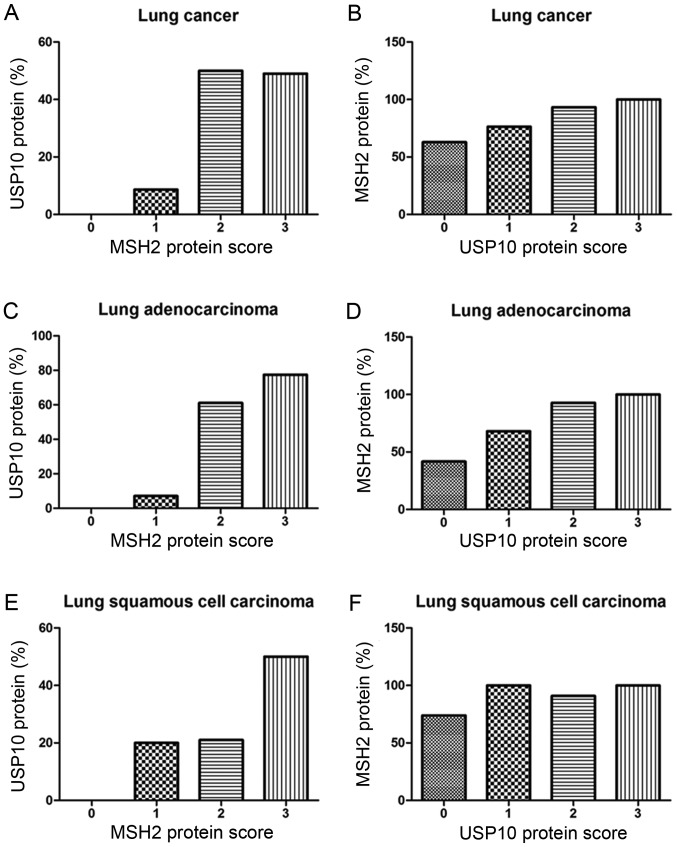
Figure 4.
Correlation between USP10 and MSH2 protein expression in (A and B) lung cancer, (C and D) lung adenocarcinoma and (E and F) lung squamous cell carcinoma tissues. The x-axis represents the score of USP10 or MSH2, and the y-axis represents the corresponding positive rate of MSH2 or USP10. MSH2, MutS homolog 2; USP10, ubiquitin-specific protease 10.

