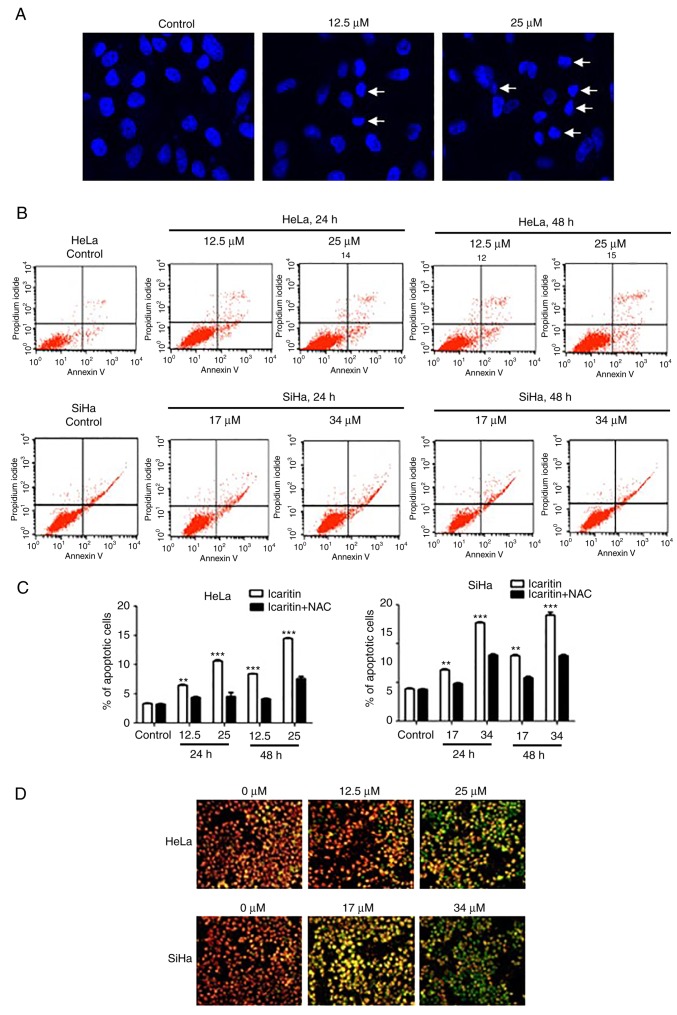
Figure 7.
Analysis of apoptosis. (A) Representative images of nuclei stained with DAPI. HeLa cells were treated with 1× IC50 or 2× IC50 icaritin for 24 h (arrows point to nuclei of apoptotic cells). (B) Analysis of Annexin V-fluorescein isothiocyanate and propidium iodide-stained cells by flow cytometry. HeLa or SiHa cells were treated by 1× IC50 or 2× IC50 icaritin for 24 h or 48 h. (C) Quantification of flow cytometry data from three independent experiments. HeLa or SiHa cells with or without pre-incubation (1 h) with 5 mM NAC were treated with 1× IC50 or 2× IC50 icaritin for 24 h or 48 h (**P<0.01; ***P<0.001). (D) Measurement of mitochondrial membrane potential by JC-1. HeLa or SiHa cells were treated by 1× IC50 or 2× IC50 for 24 h. IC50, half maximal inhibitory concentration.

