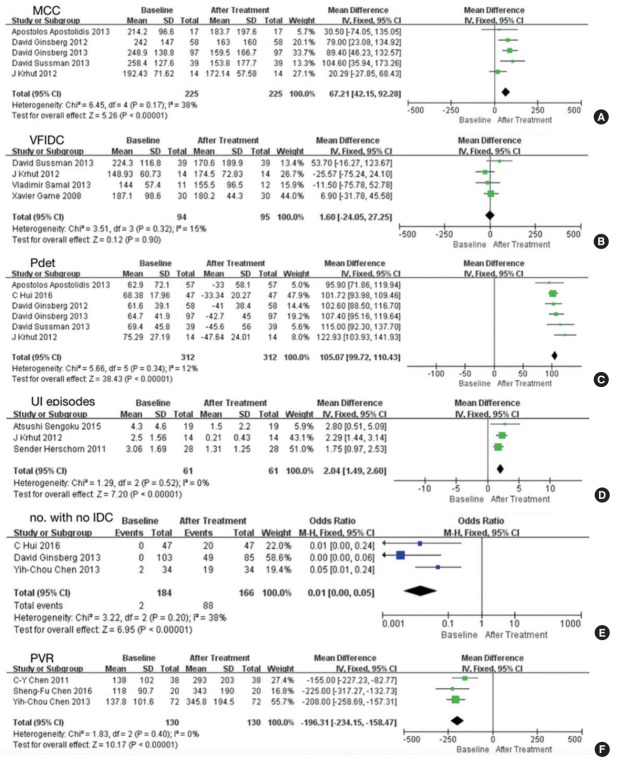
Fig. 4.
Forest plots comparing the effect of onabotulinumtoxinA (BoNT-A) on baseline values versus posttreatment values of maximum cystometric capacity (MCC) (A), volume at first involuntary detrusor contraction (VFIDC) (B), detrusor pressure (Pdet) (C), urinary incontinence (UI) episodes (D), number of patients with no involuntary detrusor contraction (IDC) (E), and postvoid residual volume (PVR) (F). SD, standard deviation; CI, confidence interval; df, degrees of freedom.

